Andrew Arizaga - My Engineering Portfolio

Disclaimer: This project is a work in progress. Updates and improvements are ongoing!

Python-Based Ladder Iterative
Load Flow Tool

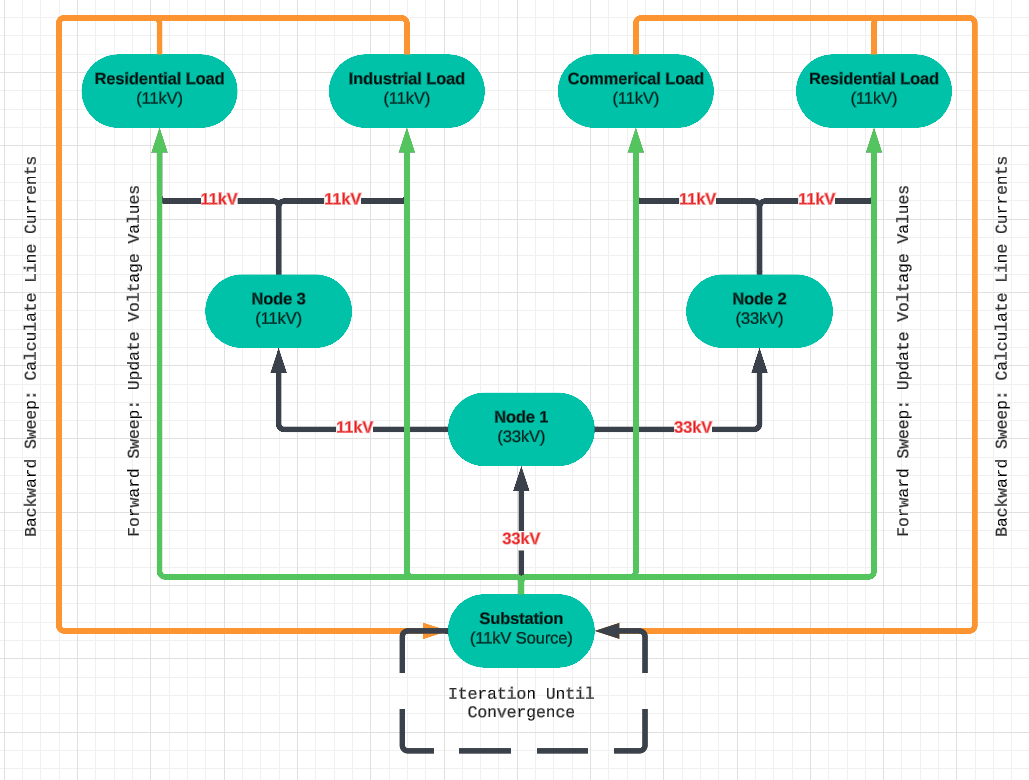
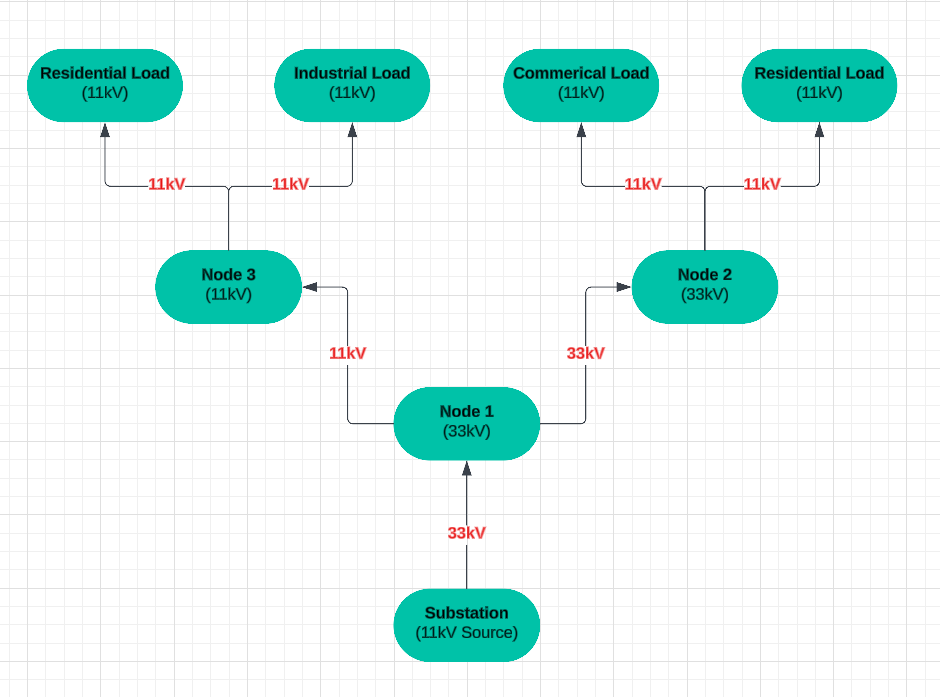
The Python-Based Ladder Iterative Load Flow Tool addresses critical challenges in radial power distribution networks, including voltage drops and inefficiencies. Designed with engineers and researchers in mind, this tool combines computational accuracy with user-friendly features. By leveraging Python and the Ladder Iterative Method, it facilitates robust grid analysis, ensuring stability, efficiency, and adaptability for modern power systems.

Project Overview

Project Description

Overview

Power Grid Overview

The Python-Based Ladder Iterative Load Flow Tool is a software application developed to analyze and optimize radial power distribution networks. These networks are prevalent in urban and residential areas and face challenges such as voltage drops, inefficiencies, and fault sensitivity. This project bridges the gap between theoretical academic concepts and practical engineering applications, providing a robust solution for efficient power distribution.

What is the Ladder Iterative Load Flow Tool?

Ladder Iterative Method

The Ladder Iterative Load Flow Tool uses a step-by-step computational approach to solve power flow equations in radial distribution networks. It works by:

  • Branching Iterations: Starting at the substation, it calculates voltage and current for each branch of the network.
  • Backward Sweep: Propagates from the load nodes back to the source to compute line currents.
  • Forward Sweep: Moves from the source to the load nodes to update voltage values.

This iterative process continues until convergence, ensuring stability and efficiency in power flow analysis.

Radial Distribution Network Diagram

Radial Distribution Network Diagram

The Radial Distribution Network Diagram visualizes the flow of electricity in a radial system, starting from the substation and branching out to various loads. It highlights voltage drops, load connections, and how this tool improves efficiency and stability across the network. The tool ensures that engineers can effectively analyze and plan these systems for enhanced performance.

How It Works

Step 1: Input System Data

Input Data Overview

The tool begins by importing power system data structured in IEEE format. Data such as:

  • Node identifiers and voltage levels.
  • Active and reactive power demands at each load.
  • Line impedances and the Y-bus admittance matrix.
are read from Excel spreadsheets. The modular design ensures compatibility with radial systems of varying sizes and complexities.

Step 2: Construct the Radial Network Model

Radial Network Model

The system topology is mapped into a directed graph using adjacency lists, capturing:

  • Connections between nodes.
  • Branch lengths and impedances.
  • Shunt capacitance and distributed generation data.
This graph-based representation forms the basis for iterative calculations and ensures efficient traversal during sweeps.

Step 3: Backward Sweep

Backward Sweep Process

The backward sweep propagates from the terminal nodes back to the slack bus, performing calculations for:

  • Real and reactive power flows on each branch.
  • Current injections at each node, considering local loads and shunt elements.
  • Total line losses by summing branch-wise contributions.
This sweep ensures that upstream current distributions reflect all downstream load requirements.

Step 4: Forward Sweep

Forward Sweep Process

The forward sweep recalculates node voltages moving from the slack bus to the terminal nodes. Using:

  • Branch current values from the backward sweep.
  • Known branch impedances.
  • Voltage at the previous node (starting from the source).
Voltage drops are iteratively corrected, ensuring accuracy across all nodes.

Step 5: Iteration Until Convergence

Convergence Process

Backward and forward sweeps are repeated until the following convergence criteria are met:

  • Node voltage variations fall below a predefined tolerance (e.g., 0.01%).
  • Line current variations stabilize across iterations.
  • Power losses converge to a consistent value.
These conditions ensure numerical stability and accuracy in the final results.

Step 6: Results and Visualization

Results and Visualization

Results include:

  • Voltage profiles at all nodes.
  • Current and power flow on each branch.
  • System-wide power losses and efficiency metrics.
Interactive visualizations, such as voltage contour maps and load-flow diagrams, allow engineers to analyze performance and identify bottlenecks.

Applications and Benefits

Grid Planning

Grid Planning

Efficiently planning and designing power distribution systems is critical. This tool provides:

  • A granular analysis of load distribution and voltage drops.
  • Optimization of power flow to reduce energy losses.
  • Seamless integration with existing IEEE-standard workflows.

Renewable Energy Integration

Renewable Energy Integration

Renewables like solar and wind are reshaping grids. This tool enables:

  • Accurate modeling of renewable energy sources' impact on the grid.
  • Scenarios for energy storage integration.
  • Strategies to handle fluctuating power inputs.

Fault Detection and Mitigation

Fault Detection

Reliability is paramount for any power grid. With this tool, engineers can:

  • Identify weak links in the system.
  • Predict failure points through iterative analysis.
  • Implement targeted upgrades for maximum efficiency.

Future-Ready Power Grids

Future Ready Grids

As grids evolve, this tool lays the groundwork for:

  • Smart grid functionalities, including real-time monitoring and fault isolation.
  • Advanced demand-response strategies.
  • Integration of IoT-based sensor systems for enhanced grid performance.

Technical Challenges and Solutions

Developing the Python-Based Ladder Iterative Load Flow Tool posed several complex challenges...

Handling Large Datasets

Challenge: Processing large-scale radial distribution networks required...

Solution: Memory-efficient algorithms were implemented...

Ensuring IEEE Compliance

Challenge: The input and output data formats needed to align with IEEE standards...

Solution: A custom parser was developed...

Visual Showcase

Overview

The Visual Showcase highlights the key features and outcomes of the Python-Based Ladder Iterative Load Flow Tool. Below are snapshots and diagrams that provide insights into how the tool functions, its impact on radial distribution networks, and the innovative solutions it offers for power system analysis.

Details

The images above include:

  • Tool Interface Overview: A snapshot of the Python-based GUI showcasing the input and output process.
  • Voltage Stability Graph: A graph depicting stable voltage levels across nodes in the network.
  • Power Flow Chart: A detailed representation of power flow efficiency and losses.
  • Network Visualization: A diagram illustrating the radial distribution network and its components.
Back to Projects